FSLogix Copy=3, the redirections.xml Trick for Non-Persistent VDI
Three lines in FSLogix redirections.xml took SAP Business One launch times from ~2 minutes to ~1 on non-persistent Citrix VDAs. The Copy=3 attribute is the underused trick that makes it work.
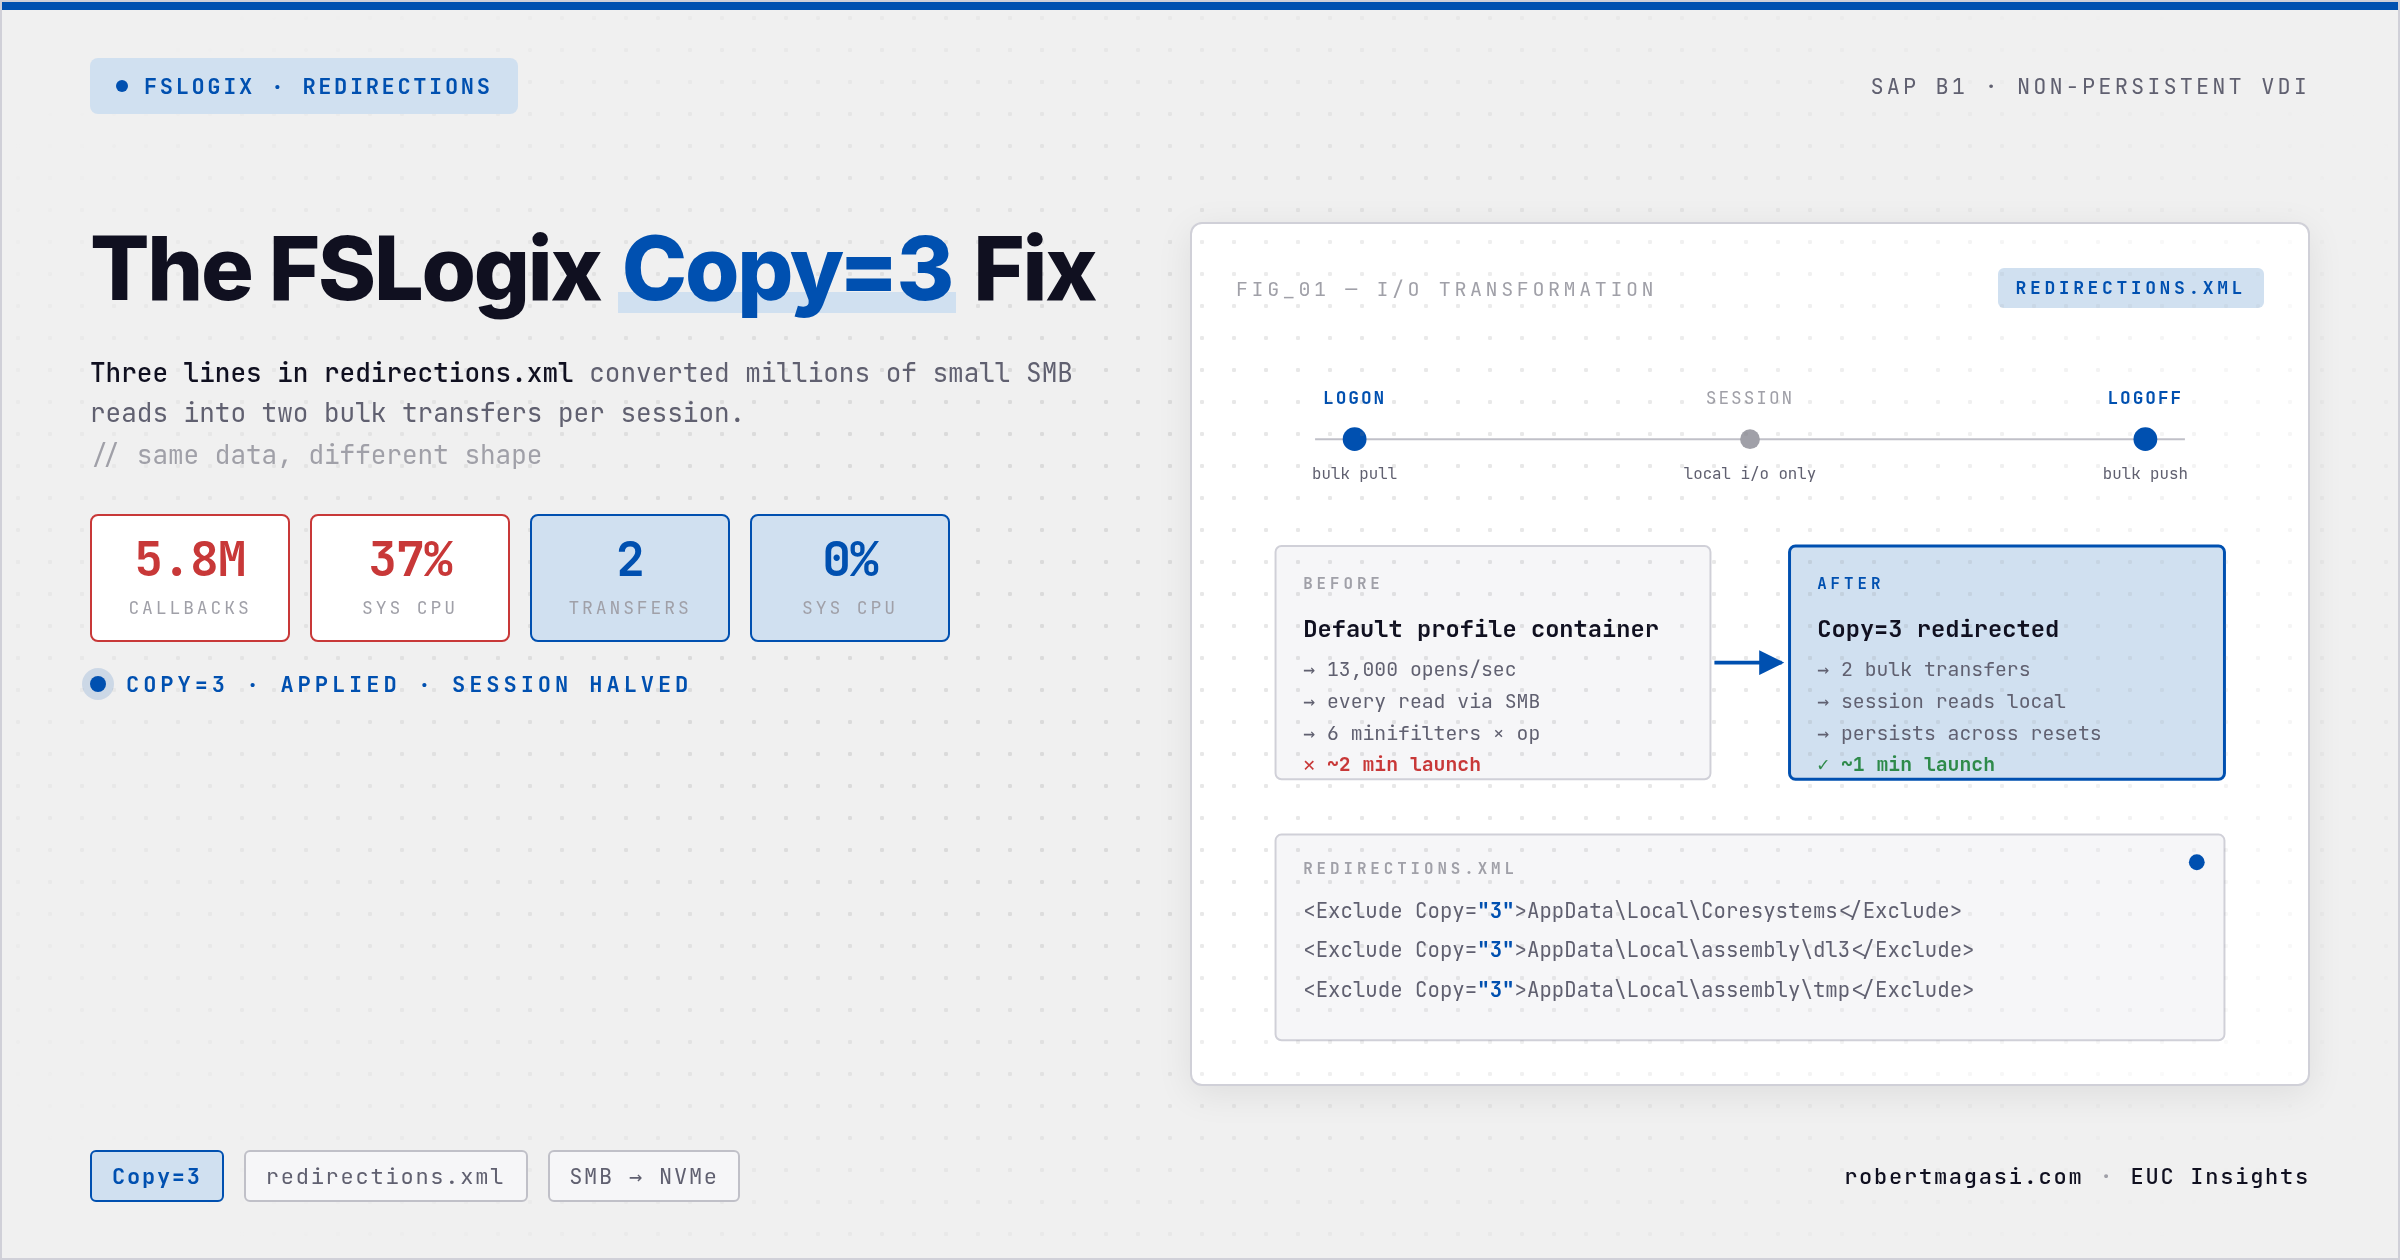
By the time this chapter of the escalation started, I had already fixed the worst of it. SAP Business One launches had come down from a catastrophic 10-30 minutes (a story for another post) to a steady 2 minutes on every login. Users were productive again. The taskforce still wasn’t closed. The Windows System process (PID 4) sat at 37% CPU across all 8 cores while coresuite was doing its start-up work, and the session felt sluggish behind it while it “installed and customised” itself into a fresh profile. Two minutes was survivable. It was also wrong. This post is about the three lines of XML that took it to one minute and gave the System process back to the kernel.
The Situation
Non-persistent Citrix DaaS VDAs on Windows Server, MCS-based clones, FSLogix Profile Container hosted on an SMB share. SAP Business One with the coresuite add-on installed. Coresuite has a habit users don’t see, on first launch per session it drops per-database compiled .NET assemblies into %LOCALAPPDATA%\Coresystems and %LOCALAPPDATA%\assembly\dl3. On a non-persistent VDA those paths live inside the FSLogix profile container, which means every DLL read is an SMB round-trip. Multiply that by the roughly 13,000 file opens per second the application was generating at launch and the pattern is obvious once you look at the trace.
Every login. Every user. Even when the compiled assemblies were already present in the container from a previous session.
What I Chased First
Defender was the obvious next suspect after the earlier MDE cleanup. I added process, path, and extension exclusions for coresuite, the SAP B1 binaries, the .NET compilers (csc.exe, vbc.exe, mscorsvw.exe, ngen.exe, RegAsm.exe), the CLR temp folders, and WEM. Verified with Get-MpPreference. MsMpEng.exe dropped to 0% CPU during launch, which is exactly what a correctly excluded workload looks like. The symptom didn’t move. (Weeks later I discovered most of those exclusions had never matched anything thanks to trailing newline characters in the saved entries. The conclusion here still holds, but that war story gets its own post.)
Ruled out DPCs and ISRs next, the kernel-side interrupt work that is the usual suspect when the System process burns CPU without an obvious owner. A WPR/WPA trace over a full launch cycle showed total DPC + ISR time was 2.5 CPU-seconds across 217 seconds of trace, or 0.14% of the available CPU. The kernel wasn’t spending time in interrupt handlers.
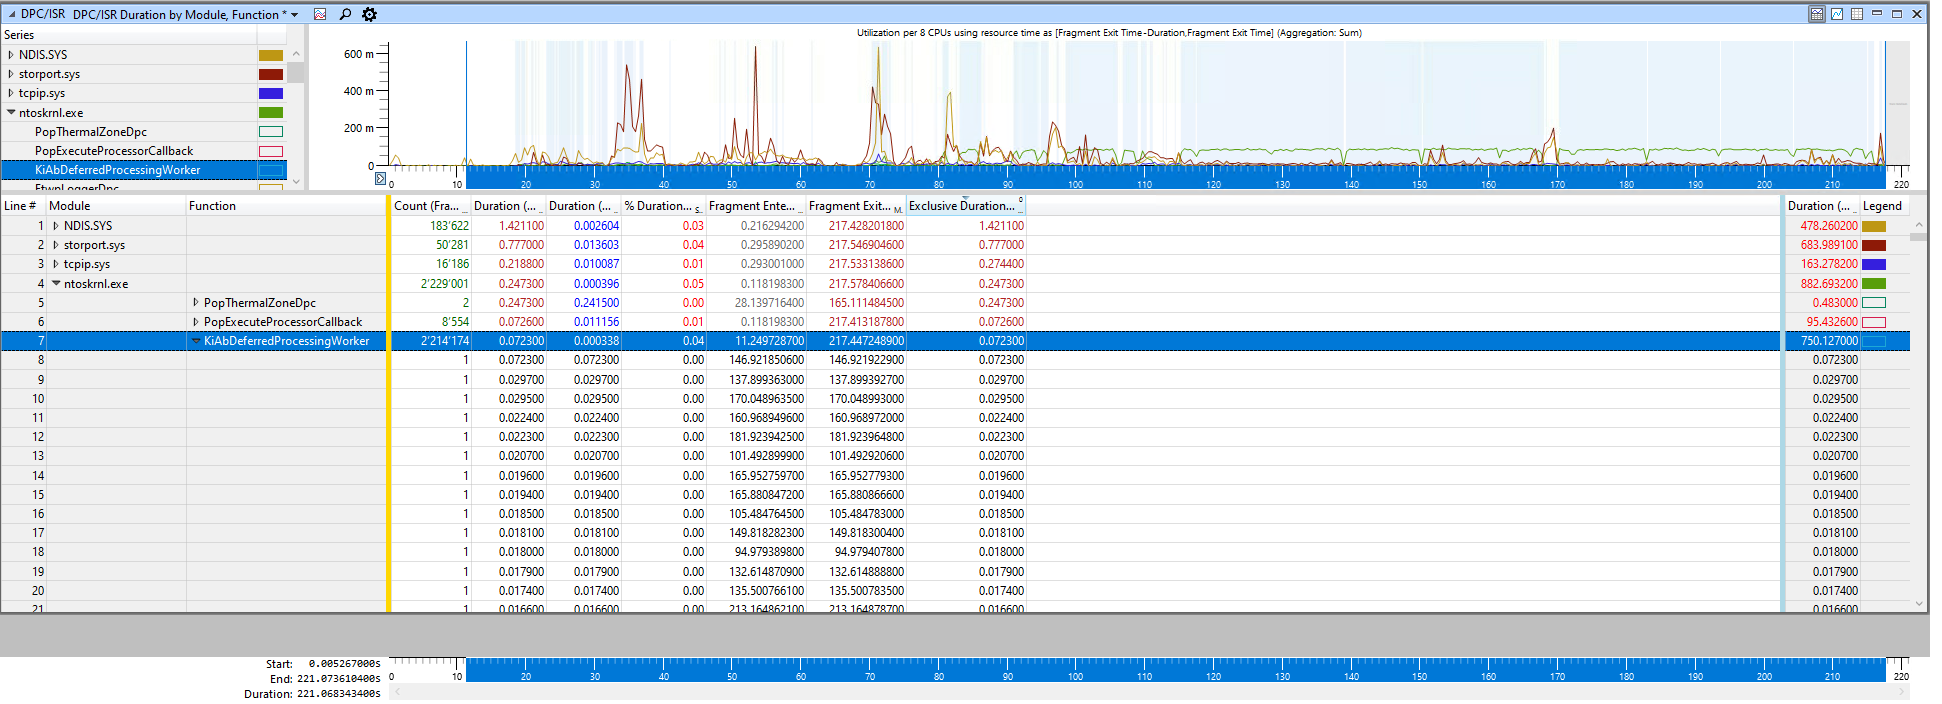 Windows Performance Analyzer DPC/ISR by Module view. Total DPC + ISR time was 2.5 CPU-seconds across the trace, ruling out driver interrupts as the cause.
fltmc showed six active minifilters in the I/O path: MsSecFlt (MDE), WdFilter (MDAV), frxccd (FSLogix Cloud Cache, loaded but idle), frxdrv (FSLogix base), upmjit (Citrix UPM), and frxdrvvt (FSLogix virtualization). Quick primer, a filesystem minifilter is a driver that sits above the actual file system and gets called on every read, write, open, and metadata operation. Antivirus, EDR sensors, backup agents, encryption drivers, and profile management tools all install one, and they stack in altitude order. Each one gets a callback on every I/O, and the callbacks run in series. Six of them stacked means every file open pays six times the per-callback cost. That was the shape of the answer, but I still needed the specific evidence.
The Diagnosis
The turning point was xperf minifilterdelay on the full trace, aggregated in PowerShell. The raw export was a 7 GB plain-text file, which not even Notepad would open. I had to slice it into smaller chunks before it was workable, and after aggregating in PowerShell the numbers came out unambiguous. 5.8 million filter callback events across 217 seconds, averaging 27,000 per second and peaking above 50,000. frxdrvvt.sys was the top by total time, with one single 225ms callback outlier. The CREATE operation (file open) accounted for 53% of all filter callback time. QUERY_VOLUME_INFORMATION averaged 211 microseconds per call, the classic signature of an SMB round-trip. The top file by callback frequency was on the profile share, buried under \coresuite\.
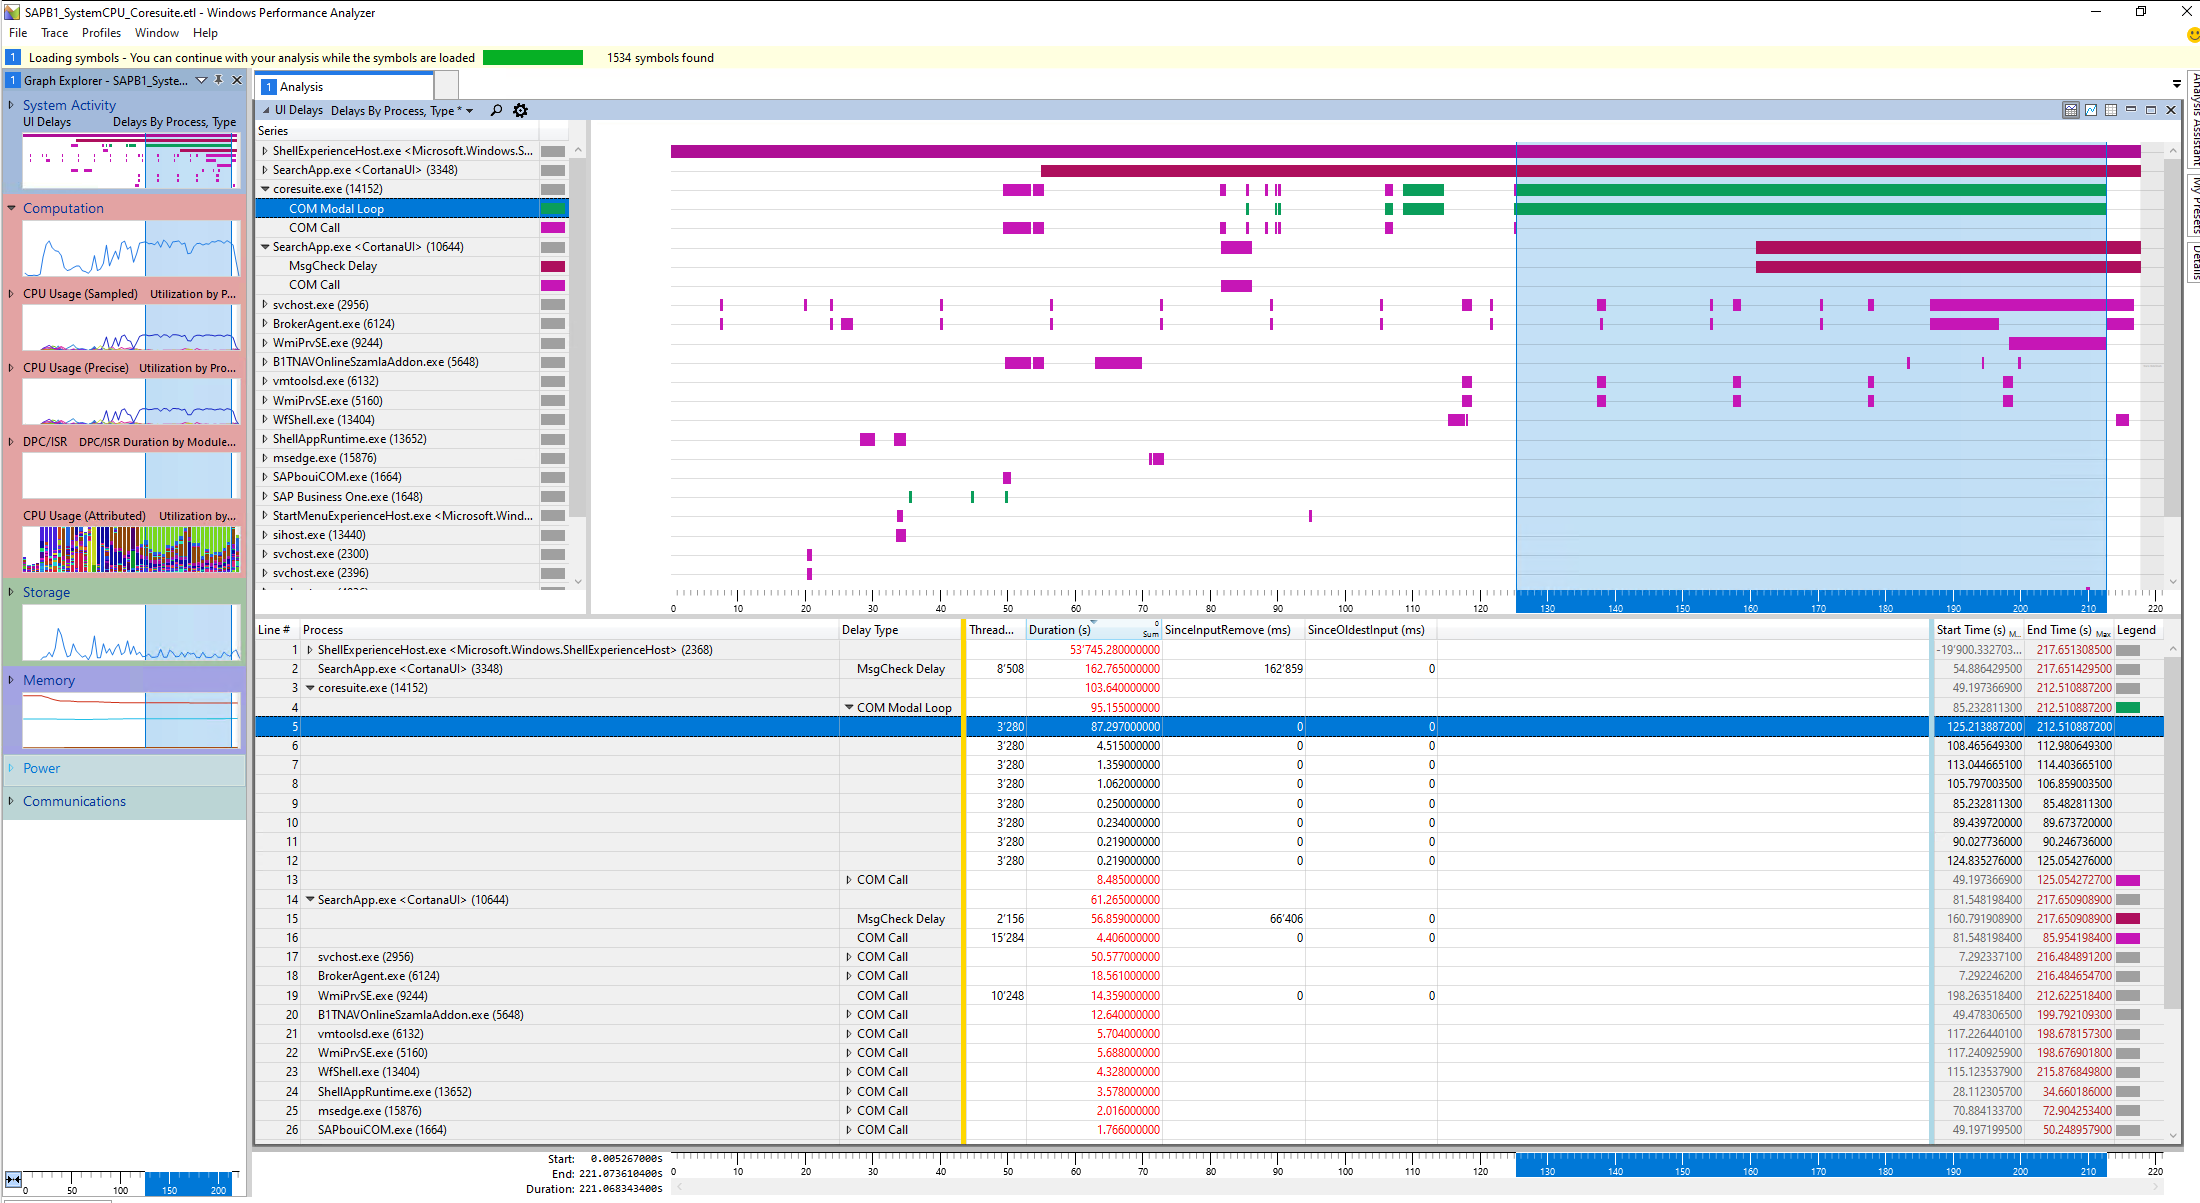 Windows Performance Analyzer UI Delays view. The highlighted row is a single 87-second COM Modal Loop in coresuite during launch. SearchApp posted a 162-second MsgCheck delay in the same window.
The shape of the workload was the problem, not any one component. Coresuite was generating small random reads against a network-backed profile container, and each read had to traverse all six minifilters in series. No single filter dominated. No single process dominated. The system was drowning in file-open microbursts.
The Fix
Three lines added to redirections.xml:
1
2
3
<Exclude Copy="3">AppData\Local\Coresystems</Exclude>
<Exclude Copy="3">AppData\Local\assembly\dl3</Exclude>
<Exclude Copy="3">AppData\Local\assembly\tmp</Exclude>
The Copy="3" attribute is the important part. Most examples online show Copy="0" for cache folders, which excludes them entirely and forces regeneration every session. On non-persistent MCS clones that would mean every user re-compiling their coresuite assemblies on every single logon, which is essentially the original symptom rebranded. Copy="3" means bidirectional sync between the FSLogix VHD and the local VDA disk. At logon, FSLogix pulls the excluded folders from the VHD to local NVMe once as a bulk sequential SMB transfer. All session I/O then runs against the local copy. At logoff, FSLogix pushes any changes back to the VHD. On non-persistent MCS clones the assemblies survive across reboots exactly like before, but during the session they behave like local files.
Same amount of data moves across SMB per session, the shape is completely different. Two bulk sequential transfers instead of millions of small random reads.
One consequence of
Copy="3"worth watching, FSLogix copies the excluded folders to the local user profile atC:\Users\local_<username>at logon. In this environment those clones run MCSIO, which redirects C: writes onto the write cache disk (the D: drive), so the coresuite content lands there. If you don’t use MCSIO the writes stay on C: and the same watch applies to whatever underlying disk holds it. Under normal use the content is not large and the cache handles it comfortably. In a scenario with many users cycling in and out of sessions on the same host over a working day, the cache can grow faster than it used to. It has not caused an incident here yet, but write-cache free space is on the watch list until we have a longer sample of real usage.
A Note on the Workload Itself
One thing worth flagging before anyone applies this workaround to their own environment. The pain in this post is specific to a newer coresuite build. In the customer’s older production environment, coresuite does not drop those per-database compiled assemblies into %LOCALAPPDATA% at all, the per-user assembly storm is absent, and none of this shows up. The behaviour that generates the storm was introduced with the newer coresuite release, and the pain is specific to running that version.
From the outside it looks more like a specific design choice than a technical requirement, and the older release did not make it. If you are on the newer coresuite and hit the same wall, the redirections.xml trick above is the right workaround. If you are still on the older release, it is worth knowing the pattern is there so a future upgrade does not surprise you.
Two Things That Still Matter
Even though the Defender exclusion configuration wasn’t the root cause of this particular symptom, correct AV exclusions still matter for every FSLogix deployment. Process exclusions for the two FSLogix services (frxsvc.exe, frxccds.exe) and driver-file exclusions for the three .sys files (frxdrv.sys, frxdrvvt.sys, frxccd.sys), plus path exclusions for the VHD/VHDX locations and the mount temp folders, are in the Microsoft docs for a reason. Get them right and validate them by behaviour, not just by presence in Get-MpPreference output. Reference, Microsoft FSLogix antivirus prerequisites.
The other trap, the master image must never be onboarded to Defender for Endpoint. Microsoft is explicit about this in the VDI onboarding guidance, and an onboarded master means every MCS clone inherits the same sensor identity, with the cloud seeing one device flapping between many hostnames and MsSense.exe at unexplained high CPU on every clone. My guard against it is a startup script that runs the MDE onboarding, linked via GPO to only the OU that holds the deployed clones, never the OU that holds the master. The full mechanics, senseGuid, the Cyber folder, and the cleanup procedure, are worth a post of their own, and they’ll get one.
The Result
- SAP B1 launch time from ~2 minutes to ~1 minute (from 10-30 minutes at the start of the wider engagement)
- Windows System process CPU during launch dropped from ~37% back into the idle range
- Coresuite finishes its “installing and customising” phase in about a minute, previously multi-minute with the whole session sluggish behind it
- No changes to Defender, no changes to the storage backend, no re-architecture of the profile container
What I’d Tell a Colleague
“Defender is slow” is almost never Defender on its own. When you’ve applied every exclusion the docs recommend and MsMpEng.exe drops to 0% CPU but the symptom stays, the filter driver stack is doing work on behalf of I/O that Defender didn’t cause. Minifilter chains compound, six active filters times 5.8 million operations is tens of CPU-seconds nobody attributes to any single component. If your VDA has more than three or four minifilters registered (check with fltmc), consider the I/O volume before you consider the individual drivers.
FSLogix on SMB is well-behaved for well-behaved workloads. It’s brutal for applications that memory-map hundreds of small DLLs per launch. redirections.xml with Copy="3" is the underused tool for exactly those cases, and non-persistent VDI is exactly the environment where it earns its keep.
Sources
- Microsoft, FSLogix redirections.xml concepts and the Copy attribute
- Microsoft, Configure FSLogix redirections tutorial
- Microsoft, FSLogix antivirus prerequisites
- Microsoft, Onboard non-persistent VDI devices to Defender for Endpoint
- Microsoft ntdebugging blog (archived), Hotfix to enable minifilter performance diagnostics with xperf
- Microsoft, File system minifilter callback concepts
- Coresystems / SAP, coresuite for SAP Business One
Hit the same class of issue on FSLogix or another SMB-backed profile container? Reach out on LinkedIn.
This post was written with assistance from Claude (Anthropic) as a drafting and editing tool. All technical content, solutions, and recommendations reflect my own hands-on experience and professional judgment.